Abstract
Steel surfaces are frequently cleaned by abrasive impact prior to the application of protective coatings. The resultant surface profile, sometimes called an anchor pattern, is comprised of a complex pattern of peaks and valleys that must be accurately assessed to ensure compliance with job or contract specifications. (For background reading, see Substrate Surface Preparation for Corrosion Prevention.) Measured parameters include profile height, peak count, peak density and increase in surface area (rugosity).
In the protective coatings industry, replica tape is widely used for quantifying surface profile. However, as with most other means of field measurement, the tape determines only maximum profile height. Other measures of surface texture, no less meaningful, can be obtained using electron or confocal microscopes or interferometric laser profilers, but these large, complex and expensive instruments are unsuitable for field use.
Replica tape provides a reverse copy of an abrasive blast cleaned steel surface. This article re-examines replica tape as a source of other surface profile parameters required by coatings professionals. It explains how it is possible to obtain valuable new information from replica tape using simple, low-cost field devices.
Introduction to Surface Profiling for Coatings
A steel surface after blast cleaning consists of random irregularities with peaks and valleys that are not easily characterized (Figures 1a, 1b). The character of the blasted surface is predictive of paint adherence. If the peak to valley roughness is insufficient, paint will not adhere. If the peak to valley roughness is too great, the high peaks may protrude through the paint to become foci for corrosion. (For more on this topic, be sure to read Myth or Fact: Higher Surface Profile Increases Coating Adhesion.)
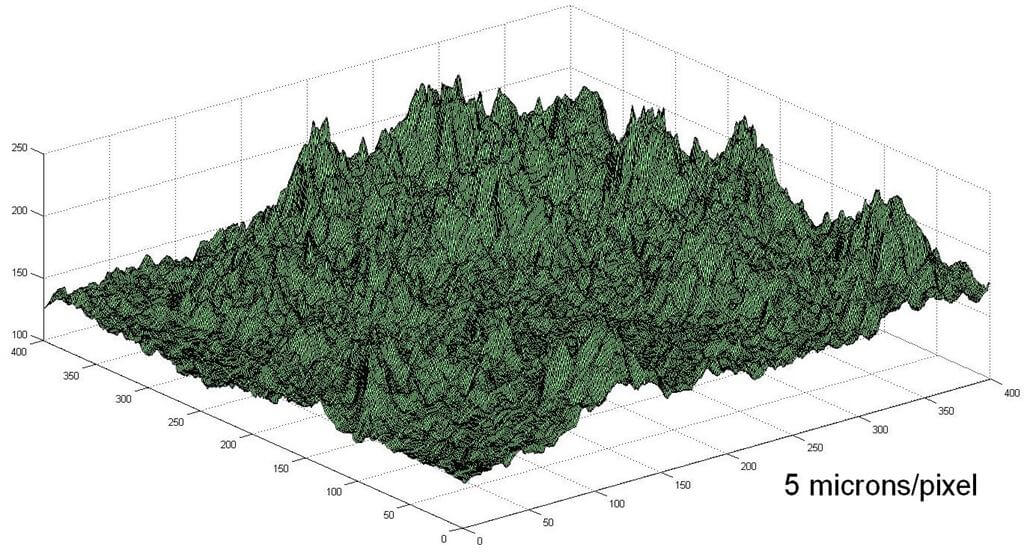
Figure 1a. Computer generated image of a blast cleaned steel surface.

Figure 1b. A blasted surface.
Various measurement methods are available to coatings professionals including focusing microscopes, surface comparators, depth micrometers and stylus roughness meters. Each method provides a portion of information. It is desirable to obtain the necessary parameters from one practical source. This article examines replica tape as that possible source.
Using Replica Tape to Measure Surface Profile
Replica tape is a long known method for characterizing a surface. It is simple, relatively inexpensive and shows good correlation with results from other methods. It is particularly useful for measurements on curved surfaces that are difficult to measure directly with stylus instruments or interferometric laser scanning or optical focal distance measuring devices. It is not surprising therefore that it has become the most popular field method for measuring surface profile. Its operation is described in a number of international standards including ASTM D4417 [1], ISO 8503-5 [2], NACE RP0287 [3], and AS 3894.5 [4].
Replica tape consists of a layer of compressible foam affixed to an incompressible polyester substrate of highly uniform thickness (50 μm + 2 μm or 2 mils + 0.1 mil). When pressed against a roughened steel surface, the foam forms an impression, or reverse replica, of the surface. The foam can collapse to about 25% of its pre-collapse thickness. Therefore, as the highest peaks on the original surface push up to the polyester backing, the fully compressed foam is displaced sideways. Likewise, the deepest valleys on the original create the highest peaks in the replica.
Placing the compressed tape (replica) between the anvils of a spring micrometer and subtracting the contribution of the incompressible polyester substrate (50 μm or 2 mils) gives a measure of the average maximum peak-to-valley surface roughness profile (Figures 2a, 2b).

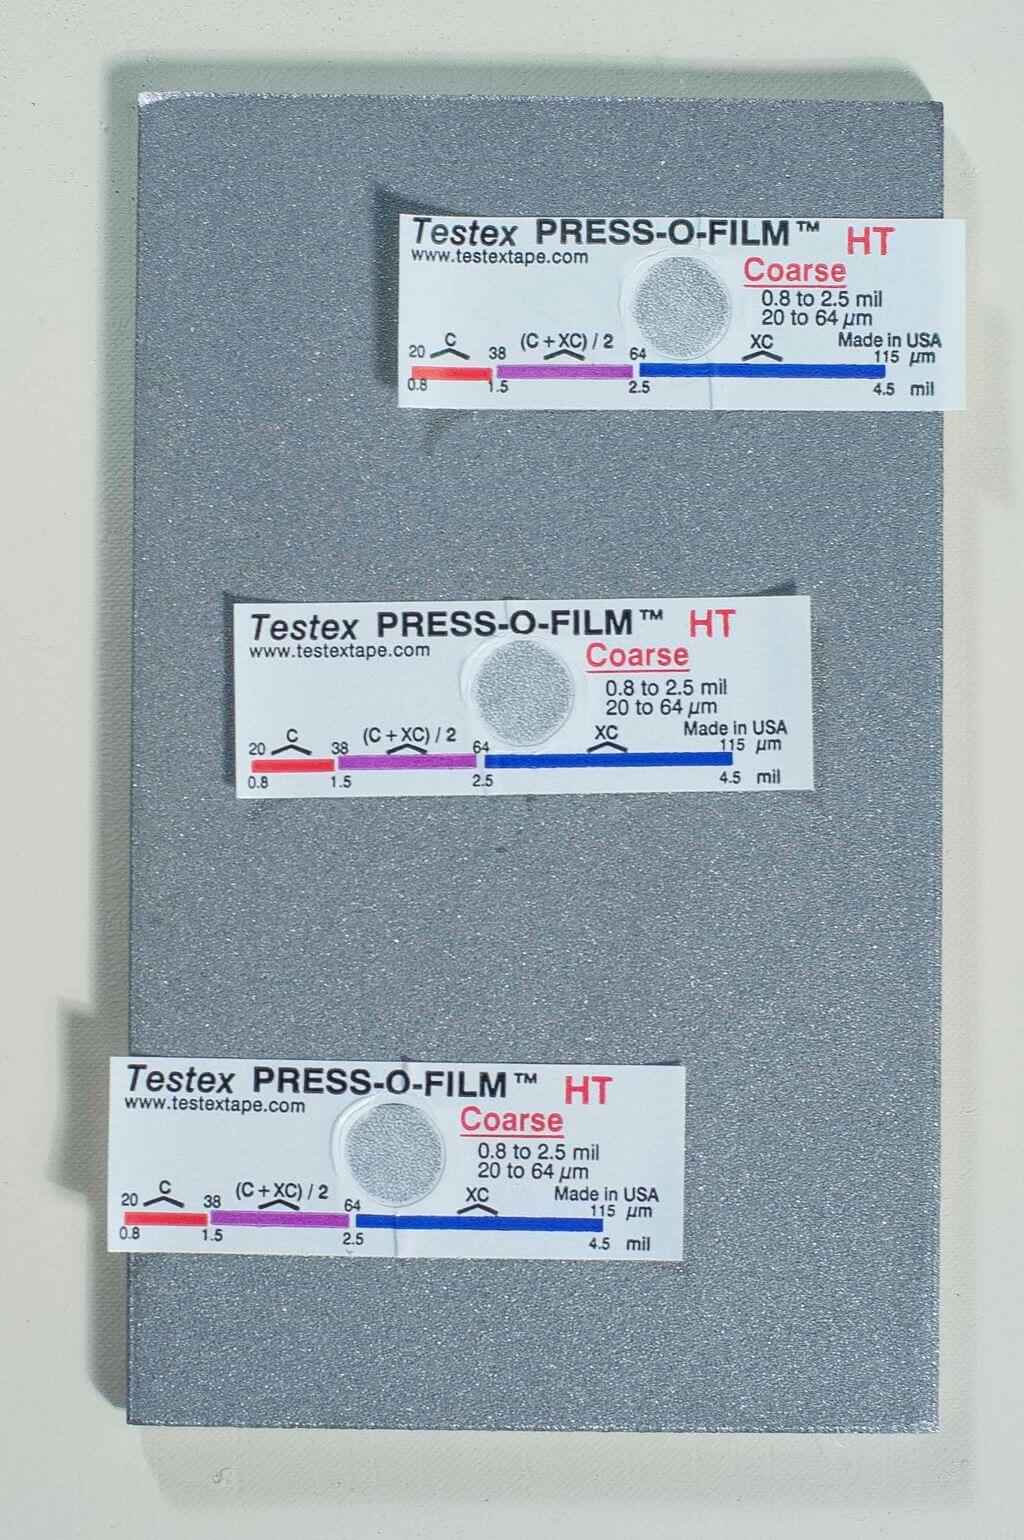
Figure 2a and 2b. How replica tape works.
Replica tape is available in several thicknesses to facilitate profile measurement in differing ranges. The primary range for measurement with replica tape is 20 to 115 μm (0.8 to 4.5 mils) covered by two grades of tape as follows:
- Coarse 20 to 64 μm (0.8 to 2.5 mils)
- X-Coarse 38 to 115 μm (1.5 to 4.5 mils)
Advantages and Disadvantages of Replica Tape
Replica tape has been used to measure the roughness profile of abrasive blasted steel since the late 1960s. Compared to other methods, it has the advantages of ruggedness, relatively low start-up cost, good repeatability and the option of retaining a physical replica of the surface being evaluated. The method is widely used and widely understood.
An additional advantage, sometimes underappreciated, is the fact that, unlike pointed probe techniques, the replica method samples a contiguous 2-dimensional area that is sufficiently large to yield robust statistics. A single electronic surface roughness tester scan, for instance, samples a line along an abrasive-blasted surface that is 12.5 mm (0.5”) long and 10 μm wide for a total area of 0.12 mm2. A single plastic foam replica samples approximately 31 mm2, an area 250 times greater.
Along with these advantages, however, come disadvantages. Most notable is the fact that this method of replication and the associated thickness determination are analog procedures and that each grade or thickness of tape is accurate over only a limited range of profile height. Spanning the range of profiles of greatest interest to the coatings and linings profession (approximately 20 to 115 μm or 0.8 to 4.5 mils) requires two grades of tape, Coarse and X-Coarse.
An unfortunate characteristic of replica tape is that measurements are most accurate near the middle of each grade’s range and least accurate at the outer ends of each grade’s range (Figure 3). That is why two other grades, Coarse Minus (<20 μm or 0.8 mil) and X-Coarse Plus (>115 μm or 4.5 mils), are used to check and, if necessary, adjust measurements at the lower and upper ends of the primary range.
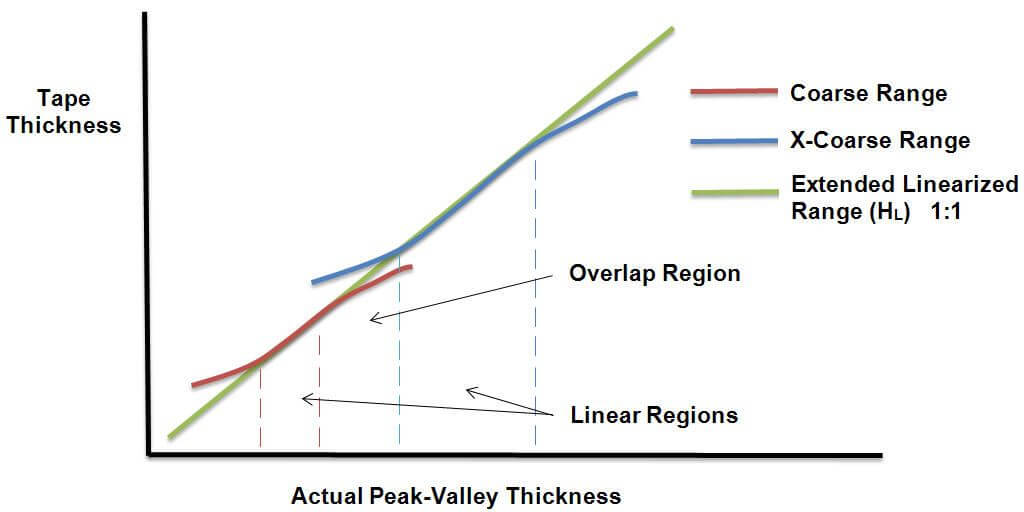
Figure 3: Non-linearity of replica tape.
The reason for the loss of linearity at the end of each tape grade’s range has to do with how the tape compresses in those thickness regions. Each thickness, or grade, of tape becomes less accurate as the peaks it is required to replicate approach the full thickness of the replicating foam. During measurement with a micrometer, peaks are compressed slightly amounting to a form of peak-height-averaging. This limits accuracy at the upper end of a grade’s range. Limiting accuracy at the lower end of its range is the fact that, much like a tightly squeezed kitchen sponge, the replicating foam reaches a state of full compression and perhaps relaxes a little (Figure 4). The result, whether at upper or lower ends, is that the replica foam’s response to compression is not linearly related to degree of compression.
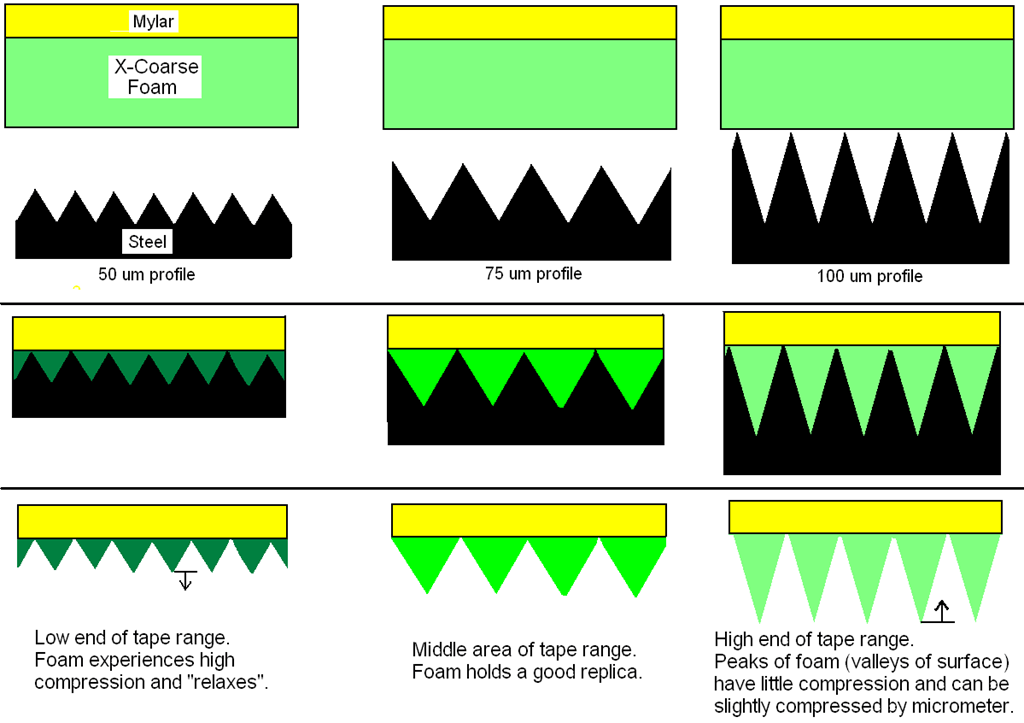
Figure 4: Reason for non-linearity of replica tape.
Correction to Improve Measurement Accuracy
The upper end of the Coarse grade’s range and the lower end of the X-Coarse grade’s range share a 38 – 64 μm (1.5 to 2.5 mils) “overlap” region (Figures 3 and 5). Current Testex instructions describe a relatively complicated and time consuming procedure (the average of one reading using Coarse grade and one reading using X-Coarse grade) that is used to knit the Coarse and X-Coarse subranges together to achieve reasonably accurate readings over the larger 20 – 115 μm (0.8 to 4.5 mils) range. This recipe is a compromise between accuracy and ease of use.

Figure 5: Overlap region of two replica tape grades.
Alternatively, the shortcomings imposed by the non-linearity and limited range of these two tape grade subranges can be compensated by a processor using look-up tables. This is not an option for a simple spring micrometer (Figure 6). Electronic instruments using powerful processors can offer users the option of displaying either the traditional direct reading of replica thickness (H) or of itself applying an adjustment value and displaying a linearized measurement of surface profile height (HL).

Figure 6: Spring micrometer.
The instrument’s processor, when switched to “linearized” mode HL, walks the user through any necessary readings (usually requiring insertion of either a single Coarse or X-Coarse grade replica) and returns a measurement adjusted for the foam’s non-linear response. This linearity adjustment tends to be small (on the order of a standard deviation) but the main advantages of the device’s signal conditioning is a reduction in measurement uncertainty, a reduction in inspector workload and likelihood of error, and a reduction in the number of replicas needed by inspectors to assure accuracy. Additionally, since each grade of tape actually works over a larger range than specified on the label, with suitable adjustment factors X-Coarse grade can be used to measure the profile in the nominal Coarse range and vice versa.
3D Surface Mapping
As interesting as this improved profile height information is, still more surface characterization data is contained in the replica’s 31 mm2 surface area. Significant new data is available through digital imaging.
A property of the tape that is related to its capacity to replicate surfaces is the tape’s increase in optical transmission where it is compressed. Transmission of light is proportional to degree of compression. A photograph of a back-lit piece of replica tape reveals light areas of higher compression (peaks) and dark areas of lower compression (valleys) (Figure 7).

Figure 7: 2D (left) and 3D (right) images derived from replica tape.
Using this transparency principle, peak counts can be determined by simply counting bright spots on the impression as taken by a digital image sensor. These brightness measurements (each comparable in size to the 5 micron probe of a stylus profile measurement device) correspond to thickness measurements, which in turn mirror the profile of the original surface. An instrument with a processor running a suitable algorithm can identify peaks and determine areal peak density, that is, how many peaks are present per square centimeter, or Pd, as defined by ASME B46.1 [5].
In contrast to stylus profilers, replica tape peak counters, like delicate and expensive laboratory-grade interferometric optical profilers, calculate true two dimensional peak densities. Stylus profilers measure only a single line on a roughened surface and most of the features it records as “peaks” are actually “peak shoulders” where the stylus traced over the side of the peak rather than over the top of the peak.
Another advantage of these images is that more data is used to derive each measurement (1,000,000 points for a single replica tape measurement vs. 5,000 points for a single 2.5 cm (1”) stylus scan). In addition, this is all done with a rugged field instrument that uses inexpensive hardware to obtain surface characterization data similar to that obtained from laboratory instruments.
Additional surface characterization parameters can potentially be extracted once the thickness/transparency relation has been applied to interpretation of the intensity image using 3D rendering software. The result is three-dimensional maps of the blasted steel surface at a cost far less than interferometric profiling devices (Figure 7).
While peak height and peak count are factors in the long-term adhesion of coatings, each contribute to a more fundamental underlying parameter: developed surface area [6], or Sdr. (For information about other factors, see Questioning Current Methods in Defining Proper Surface Profile.)
From 3D images it is possible to measure the increase in surface area resulting from a blasting operation. Sdr is a 3D field parameter that gives functional correlation to the application technique by providing coatings professionals with a rugosity value – the additional surface area created by blasting as a percentage increase (real area / x-y area) [7].
Conclusion
A simple and low cost portable apparatus using thickness and imaging sensors can characterize replica tape and generate images and statistics of the original surface. These parameters include:
- H – The average of the maximum peak-to-valley distances obtained by measuring the thickness of the replica tape with a micrometer or a thickness sensor.
- HL – A more accurate peak-to-valley height measurement adjusted for tape non-linearity without the need to average two or more replicas. This method has the additional benefit of being able to extend the range of each grade of replica tape.
- Pd – Areal peak density in accordance with ASME B46.1. This value is often cited as an indicator of the amount of mechanical bonding available to anchor protective coatings.
- Sdr – The developed interfacial area ratio expressed as the percentage of additional surface area contributed by the texture as compared to an ideal plane the size of the measurement region.
- Images – 2D and 3D renderings of the replica tape surface for documentation purposes.
Acknowledgements
The author would like to acknowledge the assistance of Leon Vandervalk of DeFelsko and Bob Stachnik of Testex.
Sources
1. ASTM D4417 “Standard Test Methods for Field Measurement of Surface Profile of Blast Cleaned Steel” (ASTM International, 100 Barr Harbor Drive, West Conshohocken, PA 19428)
2. ISO 8503-5 “Preparation of steel substrates before application of paints and related products — Surface roughness characteristics of blast-cleaned steel substrates — Part 5: Replica tape method for the determination of the surface profile” (International Organization for Standardization (ISO), 1 rue de Varembé, Case postale 56, CH-1211, Geneva 20, Switzerland)
3. NACE Standard RP0287-2002, “Field Measurement of Surface Profile of Abrasive Blast-Cleaned Steel Surfaces Using a Replica Tape”. (National Association of Corrosion Engineers (NACE), 1440 South Creek Dr., Houston, TX USA 77084-4906)
4. Australian Standard AS 3894.5-2002, “Site testing of protective coatings, Method 5: Determination of surface profile”. (Standards Australia, GPO Box 476, Sydney NSW 2001 Australia)
5. ASME B46.1-2009 “Surface Texture (Surface Roughness, Waviness, and Lay)” (The American Society of Mechanical Engineers, Three Park Avenue, New York, NY 10016-5990 USA)
6. ISO 25178-2 “Geometrical product specifications (GPS) – Surface texture: Areal – Part 2: Terms, definitions and surface texture parameters” (International Organization for Standardization (ISO), 1 rue de Varembé, Case postale 56, CH-1211, Geneva 20, Switzerland)
7. C.A. Brown and S. Siegmann, “Fundamental scales of adhesion and area-scale fractal analysis,” International Journal of Machine Tools and Manufacture, 41 (2001) 1927-1933