What Does
Sieve Analysis Mean?
A sieve analysis is an analytical technique used to determine the particle size distribution of a granular material with macroscopic granular sizes. The sieve analysis technique involves several layers of sieves with different grades of sieve opening sizes.
The finest sized sieve lies on the bottom of the stack with each layered sieve stacked above in order of increasing sieve size. When a sample of granular material is placed on the top sieve and sifted, the individual particles of the material are separated onto the final layer that the particle could not pass through. The base of the instrument contains a shaker, which facilitates the filtering.
Performing a sieve analysis is important when analyzing materials because their particle size distribution can affect a wide range of properties such as the strength of concrete, the solubility of a mixture, their surface area properties and even their taste. In a large number of industries such as food and pharmaceutics, traditional sieve analysis is a standard procedure for a variety of production methods and quality control of powders and granules. Sieving is sometimes performed when selecting media for abrasive blast cleaning.
Some advantages of the sieve analysis include easy handling, low investment cost, accurate results in a reasonably short period of time and the possibility of separating the particle size fractions.
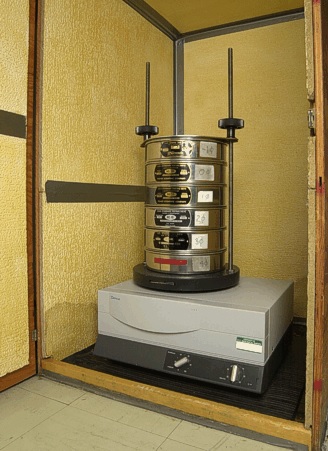
Figure 1. A commercial sieve shaker with a stack of various sieve sizes.
Corrosionpedia Explains Sieve Analysis
The popular manual sieving method is often used in locations where there is no electricity for onsite differentiation among large and small particles. Mechanical sieving methods, on the other hand, are used primarily in laboratories to assure production quality. Under mechanical sieving there are two further classifications depending upon the chosen sieving movement, and are referred to as horizontal movement sieving and vertical movement sieving. The vertical movement sieving method is also referred to as the throw-action sieving or vibratory sieving methods. The dry sieving method is mostly considered for use when particles are in a dry state. The wet sieving method is is usually used when the particles in question are already wet or in a suspension.
Sieve analysis works well for large granules that are approximately spherical in shape. Shapes that deviate strongly from spherical, such as those that are rod shaped, or granule sizes that are very small can cause errors in the sieve analysis process.
Common Sieve Types and Sizes
Sieve analysis may use sieves of various types, depending on the sieve hole size range.
Commercial sieve analyzers can weigh each individual sieve in the stack to determine the weight distribution of the particles.
A few sieve types and their nominal aperture ranges are as follows:
- Woven wire mesh sieves: 20 μm – 3.6 mm
- Perforated plate sieves: 1 mm – 125 mm
- American standard sieves: 20 μm – 200 mm
Methods for Performing a Sieve Analysis
The actual sifting process can be carried out using various methods, such as:
- Throw-action sieving involves applying a vertical force along with a circular motion to rotate granules and reorient them to pass through a sieve hole.
- Horizontal sieving uses horizontal circular motions and is the preferred method for long fibrous sample types.
- Tap sieving also uses a horizontal circular motion, but adds regular vertical taps, much like sieving would be performed by hand.
- Air jet sieving uses an air stream to disturb the material during the process.
- In cases where fine powders are present that may clog the system, wet sieving may be used for the sieving process. Each layer of the stack is then dried and weighed in a secondary step.
After the sieving process, the weight percentages of each section of the stack are analyzed according to the percentage of weight retained and then percentage of weight passed.
From this data a distribution of granule size can be displayed graphically. The distribution, called a gradation, can be described as either:
- Dense gradation
- Gap gradation
- Narrow gradation
- Open gradation
- Rich gradation