Lead is a toxic metal that is harmful to human health. The introduction of lead into drinking water occurs through the corrosion of plumbing products as water moves through the piping distribution system that consists of lead pipe service lines, lead solder and brass fittings that contain lead. For example, due to highly corrosive water in Flint, Michigan, corroded aging pipes caused extremely elevated lead concentration in water and exposed over 100,000 residents in 2014. (For more on this topic, read The Role of Corrosion in the Flint Water Crisis.)
Municipalities React to Lead in Their Water Distribution Systems
National and local governments around the world have taken steps to improve their water quality by introducing more stringent lead concentration limits. For example, in 2019, Health Canada lowered their maximum allowable concentration (MAC) of lead permissible in drinking water from 0.010 mg/L to 0.005 mg/L (5 parts per billion).
The more rigorous MAC limits necessitate a greater number of samples to be tested for lead contamination. This article outlines the objectives of scale analysis, a methodology for evaluating water piping specimens, and procedures that can be implemented.
What is Scale Analysis?
Scale analysis provides an understanding of the correlation between water quality and the mineralogical scales that are typically found on the internal walls of water distribution piping.
The benefits of scale analysis are:
- To characterize elemental and mineralogical scales from various water sources
- To correlate elemental and mineralogical scales to water quality
- To relate the mineral layers with previous changes to the water treatment
Methodology for Evaluating Lead in Water Piping Specimens
The end user specimens selected for study are often kitchen faucets, lead service pipes, galvanized premise piping, brass premise piping and brass water meters. These samples must be carefully removed without disrupting their internal surface. Any water inside them must be completely drained, and the sample’s ends must be sealed to protect against contamination. Samples are then labelled with flow direction, source location and installation orientation.
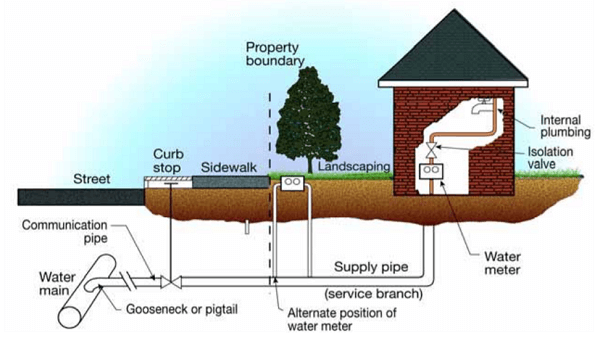
Figure 1. Typical end user premise plumbing configuration. (Source: Contribution of Service Line and Plumbing Fixtures to Lead and Copper Rule Compliance Issues by Sandvig et al.)
Analytical procedures are considered and determined based on the sample’s condition and acceptable uncertainties. The three commonly performed procedures are visual inspection, photographic and scale analysis.
Procedures for Scale Analysis
There are a number of suitable procedures available for analyzing scale on piping specimens; these are discussed in the following sections. (Learn more in The 3 Stages of Corrosion Failure Analysis.)
Initial Inspection and Photography of the Sample
After being cut open, samples are visually inspected for appearance, texture and color, and then recorded photographically. Based on the photographic resolution there are two types of photography – macro and micro (with up to 50x magnification) – as shown in the pictures below (Figure 2 and 3).
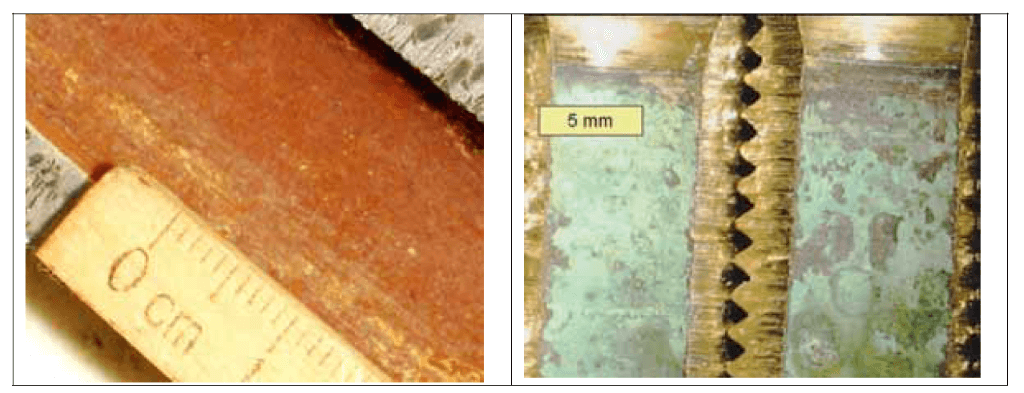
Figure 2. Macrophotograph of lead (left) and brass (right). (Source: Contribution of Service Line and Plumbing Fixtures to Lead and Copper Rule Compliance Issues by Sandvig et al.)
For lead, irregular manganese layers are visible. For brass, incomplete coverage by copper carbonate scale is visible (Figure 3).
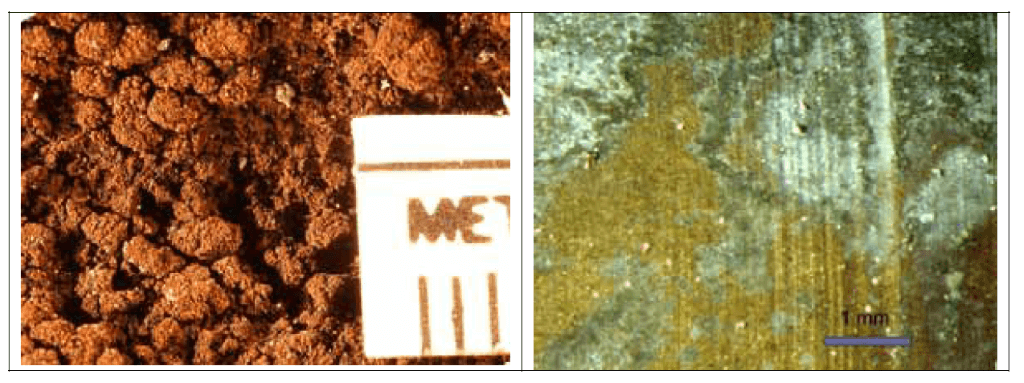
Figure 3. Microphotograph of lead (left) and brass (right) parts are shown in the photos. (Source: Contribution of Service Line and Plumbing Fixtures to Lead and Copper Rule Compliance Issues by Sandvig et al.)
Mineralogy by X-ray Diffraction (XRD)
X-ray diffraction (XRD) is the most important scale characterization tool because it reveals the major mineralogy of the scale. The scattering of X-rays from atoms produces a diffraction pattern that contains information about the atomic arrangement within the sample. As shown below by the XRD pattern from a lead sample (Figure 4), diffraction peaks are associated with specific planes of atoms.
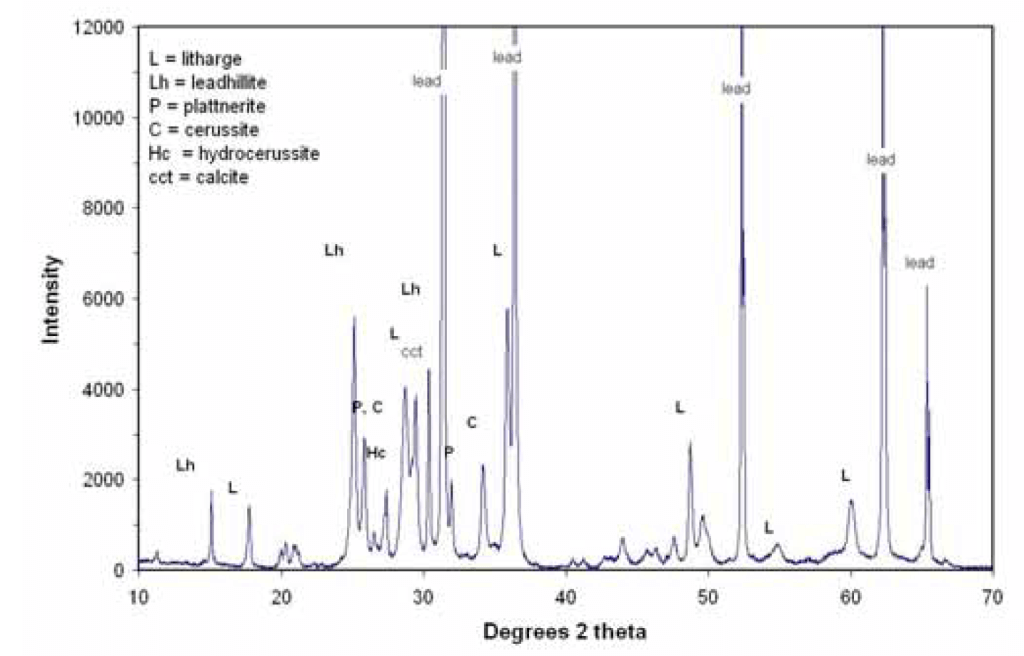
Figure 4. Plot of an X-ray diffraction (XRD) pattern from a lead sample. (Source: Contribution of Service Line and Plumbing Fixtures to Lead and Copper Rule Compliance Issues by Sandvig et al.)
Blank spectrum using cleaned pipe can be subtracted from this pattern to remove the underlying noise generated from lead metal peaks. The highest peak, in this case leadhillite at 25 degrees, is assigned a value of 100. Then the highest peak of other minerals is identified and reported as a percentage of the height of this peak.
Mineralogy by Raman Scattering
Raman scattering is an optical process where incoming excitation light interacting with a sample produces scattered light that is lessened in energy by the vibrational modes of the chemical bonds in the specimen. The benefits of Raman scattering include the ability to detect poorly crystalline phases and closely-overlapping patterns. The curve below (Figure 5) shows the Raman spectrum from pipe scale dominated by lead carbonate.
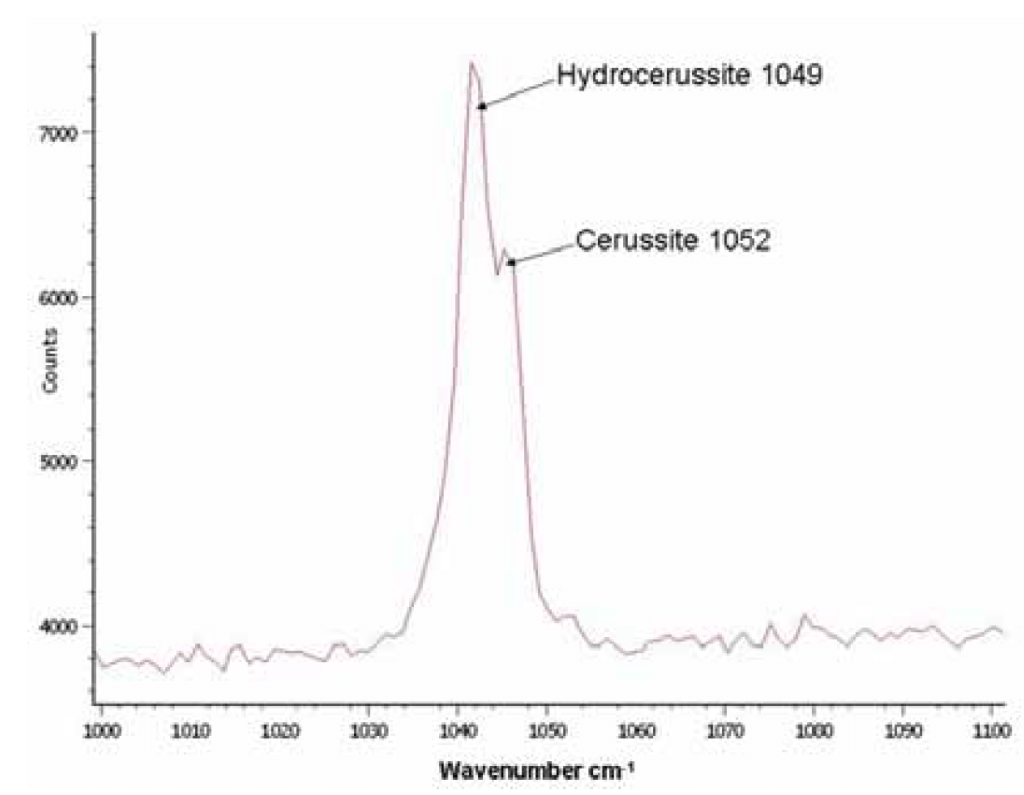
Figure 5. Raman spectrum from a pipe scale dominated by lead carbonate. (Source: Contribution of Service Line and Plumbing Fixtures to Lead and Copper Rule Compliance Issues by Sandvig et al.)
Chemistry by X-ray Fluorescence (XRF)
X-ray fluorescence (XRF) can provide the complete alloy chemistry, including percent by weight of lead in metals. XRF uses 2 to 3 grams of a combined material (sample plus spectroscopic grade powder). Interference might happen for certain elements such as barium (Ba) and copper (Cu) while other elements have less interference.
Microanalysis by Scanning Electron Microscopy (SEM) with Energy Dispersive Spectroscopy (EDS)
Scanning electron microscopy (SEM) and energy dispersive X-ray spectrography (EDX) provide much higher magnification than light microscopy, thus providing additional details such as the spatial distribution of chemical elements. Very small amounts of the sample are removed using an X-Acto knife, transferred to an SEM stub, then coated with gold-palladium to prevent charge buildup.
Scanned images of Pb carbonate (left) and Pb oxide (right) followed by the corresponding EDS patterns are shown below (Figures 6, 7).
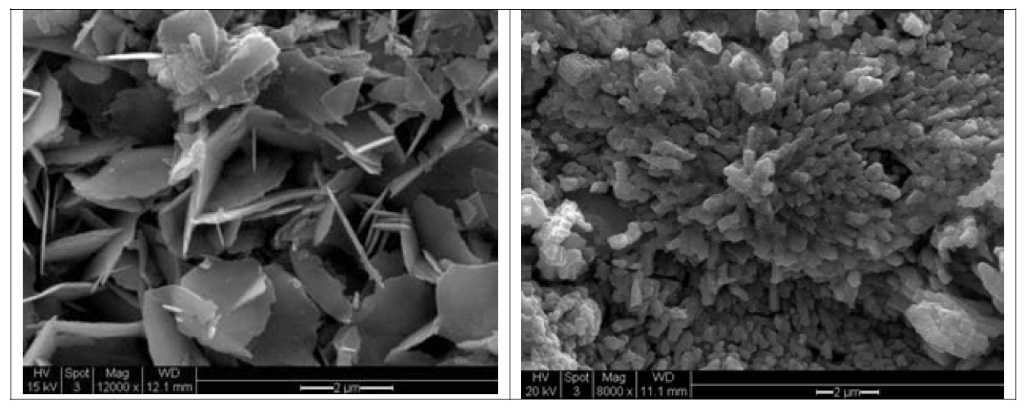
Figure 6. Scanned images of Pb carbonate (left) and Pb oxide (right). (Source: Contribution of Service Line and Plumbing Fixtures to Lead and Copper Rule Compliance Issues by Sandvig et al.)
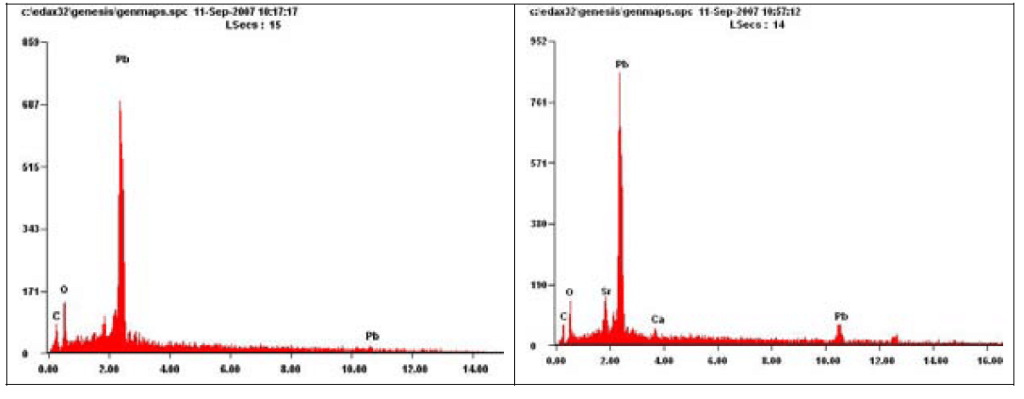
Figure 7. EDS patterns from Scanned images of Pb carbonate (left) and Pb oxide (right). (Source: Contribution of Service Line and Plumbing Fixtures to Lead and Copper Rule Compliance Issues by Sandvig et al.)
Conclusions From the Study
Conclusions of internal corrosion scales evaluated in this article are presented below.
Faucets and meters
- Dezincification was the primary lead release mechanism for new faucets and meters. This was proven by the presence of a porous zinc-depleted layer at the internal pipe surfaces. It is suspected that lead is released into the water from this layer.
- The extent of scale increases with increasing age of the pipe components. But the rate of dezincification may be inversely related to the amount of zinc.
- Scale was chemically homogeneous but the composition can be different depending on the temperature (e.g., cold water versus hot water line).
Lead and brass pipes
- A high iron and manganese presence in the water may potentially promote lead leaching as lead sorbed to iron and manganese scale on the pipe wall.
- Lead compounds related to water treatment and quality conditions were identified. For example, where phosphate was used as a corrosion inhibitor, lead phosphate pyromorphite was found.
- Along the length of pipe or fitting, scales were homogeneous. But for lead pipes, scales consisted of several layers of mostly litharge (PbO), then lead carbonates, then non-lead compounds such as manganese and calcium.